
Data?WeDon’tNeedNoStinkin’Data!
ConventionalWisdomVille
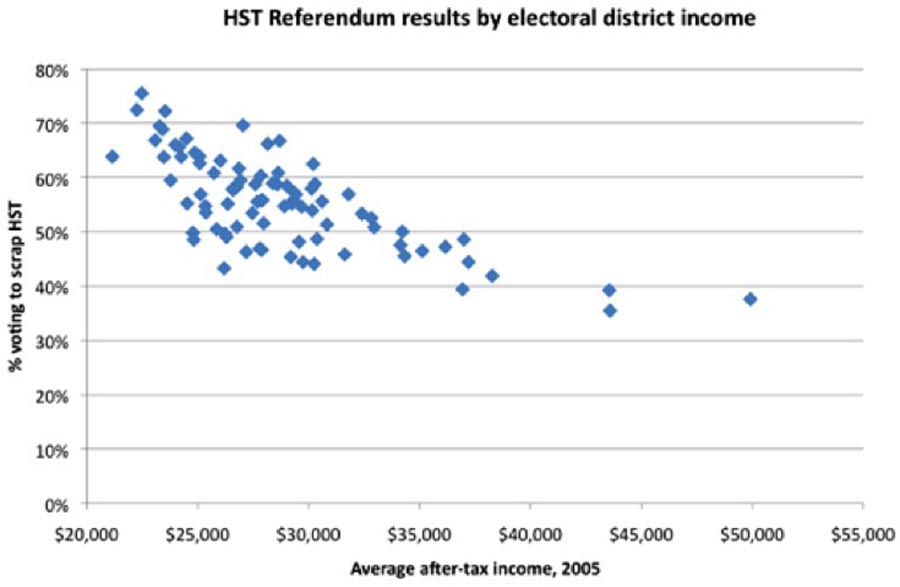
…Those With Less Income Feel Regressive Consumption Tax The Most.
The graph above was put together by Iglika Ivanova of the progressive ‘Canadian Centre for Policy Alternatives’ think-tank thingy.
The link is here.
That’s some correlation….
****
Of course, the extremes on that graph are probably split pretty much straight down the chasm that is true LINO/Dipper party divide.
But I bet there is a whole lot in the middle of that curve, especially those points high up on the Y-axis in said middle (class ridings), that is scaring the crap out of a few ‘coalition’ strate(r)gists right about now.
.